Story Time
Dr. Maya, a data scientist at CityCare Hospital, noticed long patient wait times in the emergency room. To improve efficiency, she needed to model the true distribution of wait times and compare it against proposed scheduling models.
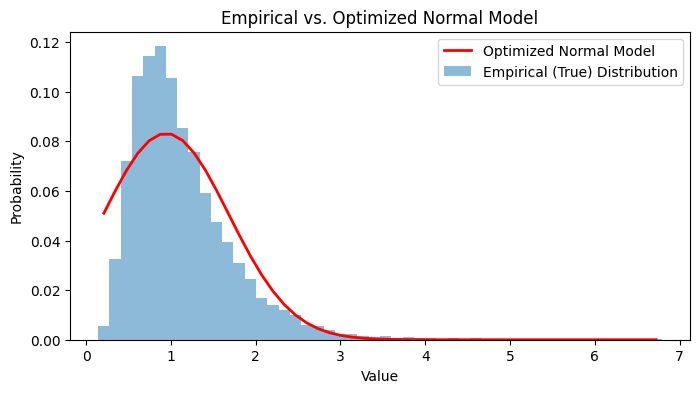
So she started gathering data about the wait times, and found out the values follow a right-skewed curve.
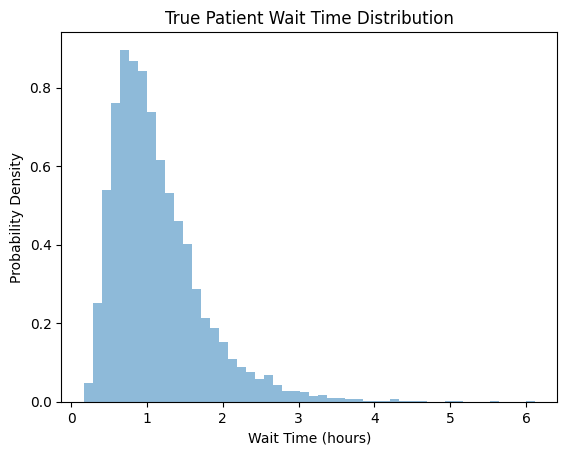
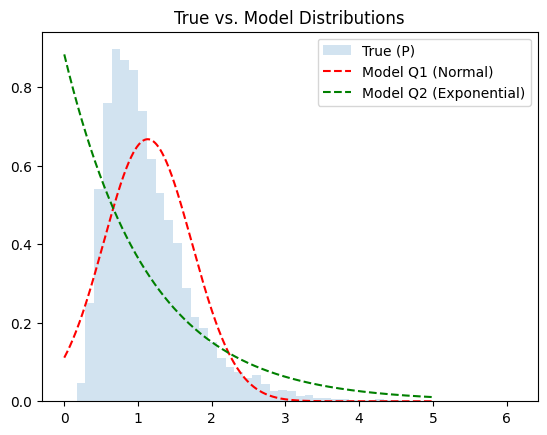
This is the actual curve of the data. But now she needs to find the actual model that encompasses this distribution. So she proposes two models —
-
Normal Distribution
\[Q_1(x)=\frac{1}{\sqrt{2\pi \delta^2}}\exp\left(\frac{(x-\mu)^2}{2\delta^2}\right)\] -
Exponential Distribution
\[Q_2(x)=\lambda e^{-\lambda x}\]
Entropy?
Imagine you run a shipping company. Each day, you receive packages labeled with different codes (say, A, B, C…), and you know the true frequency (probability) of each code from your records. Entropy tells you the minimum average number of bits you need to label these packages if you use the most efficient code possible—one that matches the true frequencies exactly.
\[H(p)=-\sum p(x)\log p(x)\]Why need another distribution?
Now, suppose you lose your records and have to guess the frequencies. You use a model distribution Q, which may not match reality. You design your codes based on Q, but packages still arrive according to P.
\[H(p,q)=-\sum p(x)\log q(x)\]You’re still shipping the same packages, but your codes are now less efficient because your guesses don’t match reality. On average, you’ll need more bits per package.
KL Divergence
KL divergence is the extra shipping cost you pay because you used the wrong map (Q) instead of the true one (P). It’s the difference between the code length you actually use (cross-entropy) and the best possible code length (entropy)
\[D_{KL}(P||Q)=H(P,Q)-H(P)=\sum P(x)[\log P(x)- \log Q(x)]\] \[D_{KL}(P||Q)= \sum P(x)\log\frac{P(x)}{Q(x)}\]If your map (Q) matches reality (P), there’s no extra cost: KL divergence is zero. The more your map differs from reality, the more you overpay—KL divergence increases.
Intuition
Step 1: Entropy (H(P)) is the expected “surprise” (bits needed) when you see outcomes from P, using codes tailored for P.
Step 2: Cross-entropy (H(P,Q)) is the expected “surprise” when you see outcomes from P, but use codes tailored for Q.
Step 3: The difference is the penalty for using codes built for Q instead of P—that’s KL divergence.
It’s like packing for a trip based on a weather forecast (your model, Q). If the real weather (P) is different, you’ll bring the wrong clothes and have to buy or improvise—KL divergence measures your average “unpreparedness.”
For our case, we get —
KL(P || Q1): 0.124KL(P || Q2): 0.262
So we see that the normal distribution is much better choice than the exponential distribution!
Can we optimize?
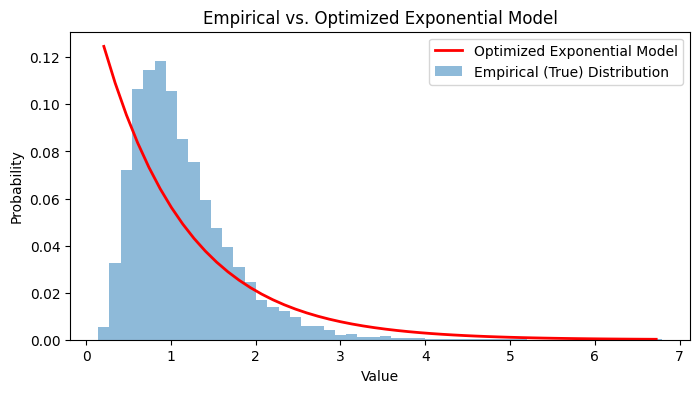
Let’s try to optimize the performance of the Exponential distribution and see if its value can be lower than Normal.
We just need to solve this optimization problem:
\[\arg \min_{\lambda}(KL(P||Q))\]At the minimum value we get the value of $\lambda$ as 0.9999
And the lowest KL Divergence comes out to be — 0.2549
So normal is still better!
So our best bet for the problem is the normal model, which is —
Conclusion
Through Dr. Maya’s hospital wait time analysis, we’ve seen how KL divergence serves as a powerful tool for model selection. By comparing how well different probability distributions capture the true data distribution, we can make informed decisions about which models to use in real-world applications.
The key takeaways:
- KL divergence measures the “cost” of using an approximate distribution instead of the true one
- Lower KL divergence indicates a better model fit
- Even with optimization, some model families may inherently be poor fits for certain data patterns
- The normal distribution proved superior to the exponential distribution for modeling hospital wait times
This practical approach to understanding KL divergence shows its value beyond theoretical statistics—it’s a crucial tool for data scientists making modeling decisions that impact real-world systems like hospital efficiency.